Magyar
  English
  Deutsch
BLOG
The Growth Spurt (PHV) and Its Impact on Hockey Development
Did you know that a hockey player's career can be influenced by the month they were born? Children born at the beginning of the year can have up to a 10-month physical advantage. But do late developers ever catch up?
Did you know that a hockey player’s career can be influenced by the month they were born? Children born at the beginning of the year can have up to a 10-month physical advantage over their peers, which significantly increases their chances of making elite teams. But does this advantage last, or do late developers eventually catch up? Why do late developers more easily fall out of the system, yet have better odds of reaching the NHL? The fascinating development of young hockey players is the result of an interplay between biological and environmental factors - and in this article we will focus on the growth process.
-This article was compiled by the Icehockeypro57 team under the leadership of Attila Orbán, where all professional support for individual player and goalie development is available-
When Were They Born?
Players born at the start of the year have a greater chance of being selected due to the relative age effect (meaning they can be 6-10 months older than others in the same age group), because they may be physically more developed than their peers. For example, the table below compares 1,200 players at the Ice Hockey World Championship (IHWC) between 2015-2017 based on their birth quarter. It is clear that nearly 50% more players born in the first quarter made it to the world championship than those born in the last quarter - and this is not even as large a difference as what is observed among youth players in the OHL.
Year Q1 Q2 Q3 Q4
2015 31.7% 22.1% 26.4% 19.8%
2016 34.5% 22.0% 24.0% 19.5%
2017 33.3% 22.1% 25.1% 19.5%
Birth distribution of 1,200 players at the Ice Hockey World Championship 2015-2017
In the Ontario Junior Hockey League, the number of players born in January is nearly five times that of those born in November, and in general 40% of elite players were born in Q1, 30% in the second, 20% in the third, and only 10% in the fourth quarter - a fourfold difference.
The relative age effect has a major impact on players’ development and careers:
-
Selection bias: Older players are bigger and stronger, making them more likely to be selected for select teams. However, this does not necessarily reflect their true skills or potential, which can distort talent identification.
-
Unequal opportunities: Younger players may receive less attention, coaching, and playing time in games, which negatively affects their development. This is especially true in U14 and younger age groups, where physical differences are the most significant.
-
Dropout risk: Younger players often feel at a disadvantage, which increases the likelihood of dropping out of the sport. In the long run, this can lead to talent loss, as many potentially outstanding players may be lost from the system.
-
Long-term success: Those relatively younger players who do reach the elite level may perform better in the long run, as they have had to work harder to overcome initial disadvantages.
The relative age effect is therefore a key issue in sports development systems, affecting fairness and the efficiency of talent identification. Within an age group, older players may be favored while younger ones are disadvantaged: if all the children on a team are similarly tall, then the primary selection factor is likely physical attributes, not necessarily skills and developmental potential. (see the majority of the winning select teams at the TELC WTT tournament)
Several strategies exist to support children at a physical disadvantage, but perhaps the most important is to understand the developmental processes and pay attention to those on the seemingly harder path - so that every player gets an equal chance to develop.
Biological Maturation
Biological maturation - the process of physical and physiological development - is perhaps the most significant influence on the careers of young hockey players (especially at junior and professional levels). Players who show early maturation (puberty and the growth spurt occurring earlier) have significant physical and mental advantages (larger body size, strength and speed).
A 2007 Canadian study examining 619 hockey players aged 14-15 found that players selected for national age-group teams were taller, heavier and biologically more mature than their non-selected peers and the age-matched control group (Journal of Sports Sciences). A 20-year analysis of Swedish junior national team players (U16) found that the proportion of early-maturing players was 30%, while late-maturing players accounted for only 19% (Sports Medicine). This physical advantage is often the result of selection bias, since the coaches running selection are frequently tasked with prioritizing current performance (winning) over long-term potential.
Interestingly, late-maturing players have a greater chance of achieving success in the NHL. According to the Swedish study, 40% of NHL players showed late maturation, while only 25% showed early maturation, and NHL players matured significantly later than non-NHL players (Sports Medicine). This is partly explained by the so-called “underdog hypothesis,” which suggests that late-maturing players, who are initially at a physical disadvantage, develop better technical skills, hockey sense and mental resilience - partly out of necessity, from playing against bigger opponents.
Surprisingly, among adult NHL players, height has a standard deviation of 3% and body weight of 8%, meaning there is far less physical variation between them than among youth players.
Level Early Maturation (%) Late Maturation (%) Note
Junior (U16) 30% 19% Bias toward early-maturing players due to physical advantages
NHL 25% 40% Higher conversion rate to the NHL for late-maturing players
Peak Height Velocity (PHV) and How to Calculate It
Peak Height Velocity (PHV) is the period of fastest growth during puberty, which typically occurs between ages 10-13 in girls and 12-15 in boys. This period is critical for physical development, as height, muscle mass and bone density increase rapidly. To precisely determine PHV, the following calculator is recommended, using the child’s date of birth, weight, and both standing and sitting height: https://wwwapps.usask.ca/kin-growthutility/phv_ui.php
The 2020 review study titled “Maturity-associated considerations for training load, injury risk, and physical performance in youth soccer” emphasizes that PHV calculations can be useful for guiding the training process, but their limitations must be understood. Current methods are not sufficiently precise, especially for early- and late-maturing individuals, so it is worth repeating the measurements at regular intervals - ideally monthly, but at least quarterly. (The PHV formula is available in section 2.4 if needed: https://link.springer.com/article/10.1007/s40279-017-0750-y)
According to research from the University of Saskatchewan, the ideal age for PHV prediction is 9-13 years for girls and 12-16 years for boys, and they emphasize that the accuracy of measurements is crucial, especially for sitting height, as errors can dramatically reduce the precision of the prediction.
Peak height velocity in girls and boys / https://www.open.edu/openlearn/mod/oucontent/view.php?id=65517§ion=1
The chart shows the height growth of girls and boys in centimeters as a function of age. The initially high growth rate after birth slows to a more steady rate by age 1. Around age 9, the rate of height increase accelerates in girls, reaching PHV (the peak) on average at age 10-11. This growth rate slows and decreases during the teenage years before growth is complete around age 15. In boys, the growth rate begins to accelerate from age 11 and reaches peak height velocity around age 13. This growth rate decreases around age 17, and growth is complete.
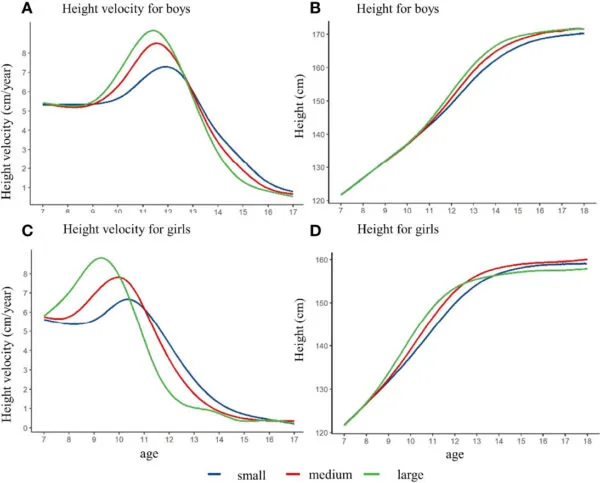 Boys and girls with different peak height velocity intensities / https://www.frontiersin.org/journals/endocrinology/articles/10.3389/fendo.2022.882840/full
Comparison of height growth in boys and girls with different growth periods after equalizing pre-pubertal height. (A) height velocity in boys; (B) height in boys; (C) height velocity in girls; (D) height in girls.
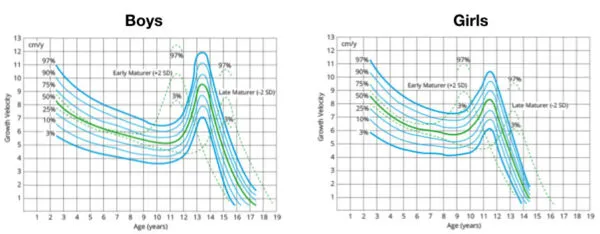 Growth velocity / https://medcell.org/tbl/disorders_of_growth/reading.php
Percentile curves on an expected height chart show what percentage ranking a child’s height occupies among children of the same age and sex. For example, if a 13-year-old boy is on the 50th percentile curve, then 50% of his peers are shorter and 50% are taller. The curves allow a child’s growth to be tracked and compared to average (50th percentile) or other percentile values (e.g., 10th, 25th, 75th, 90th). Percentile curves do not directly estimate expected adult height, but they indicate whether a child’s growth is within the normal range and can help identify potential deviations.
Distribution of the growth spurt / TRAINING THEORY FUNDAMENTALS IN ICE HOCKEY
From the distribution of the peak height velocity period, it is easy to see that there can be as much as a 3-4 year difference between early- and late-maturing children, which means that for children who began training at age 5, late developers have 50% more developmental time available. This extra time is a major advantage for an adult career for those who overcome their initial disadvantages.
Supporting late developers becomes truly understandable when we recall that statistically, even a birth date difference within the same year - that is, a 6-8 month advantage - is measurably significant. So imagine the impact of a 3-4 year growth disadvantage at a U16 tryout. For those who want to read about the biological development of young athletes in a sport-specific way in Hungarian, we warmly recommend the training theory fundamentals book from the Swedish Ice Hockey Federation’s Development and National Team Department, translated by Jim Brithén and published by the Hungarian Ice Hockey Federation, available here.
And why was understanding PHV so important?
Because the growth spurt is the most easily measurable objective indicator that helps specialists put together individual development plans - that is, for how long and in what areas a player can still be developed. Although the following chart would likely qualify for the Paint PowerPoint Cavalry Championship, its source (American Development Model) makes it well worth presenting for the PHV-adjusted development windows:
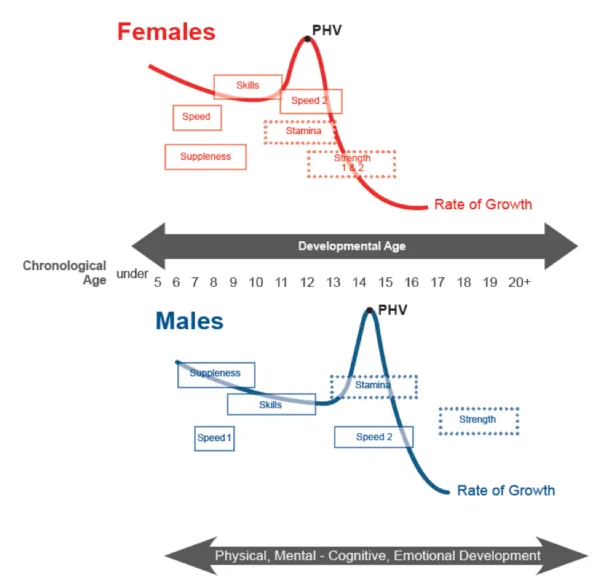 Trainability / https://www.admkids.com/page/show/1785498-v-velocity-in-phv
Peak height velocity in girls and boys, with windows of trainability
One Urban Legend Less…
Research shows that regular participation in sport does not negatively affect children’s height growth. Genetics and nutrition are the main factors that determine final height, and physical activity is generally beneficial for overall health and development. We hereby inform all worried grandmothers that playing lots of sport will not make their grandchildren short! 🙂
According to the study “Participation in sports in relation to adolescent growth and development,” regular physical training does not affect the timing, speed or magnitude of peak height velocity (PHV).
-
The study “Effects of physical activity on children’s growth” also found that physical exercises, particularly those of moderate intensity, do not affect the linear growth of children and adolescents - for example in basketball or floor gymnastics.
-
The research “Physical activity and training: effects on stature and the adolescent growth spurt” also confirms that regular physical activity, sport and training do not affect final height, the timing of PHV, or growth rate.
It is important to note, however, that intense early specialization - for example, excessive training - can carry certain risks, such as growth plate injuries, which could theoretically affect height if they lead to premature closure of the growth plates. However, these risks are generally rare and can be minimized with appropriate training programs, such as load management.
Further research, such as “Does Size Matter in Hockey?”, shows that there is no correlation between size and success in hockey. The Tampa Bay Lightning, long the team with the smallest average height, performed outstandingly, suggesting that a team’s success does not depend on height. The “Player Size and Playoff Success” analysis also found no significant trend between taller teams and playoff success, especially among forwards.
Overall, height can be an advantage in the NHL in certain situations, but it is not a decisive factor, and smaller players can also be successful if they possess outstanding skills and hockey intelligence.
How Do We Grow Tall?
Height growth is the result of the elongation of long bones (such as the femur, tibia, and humerus), which is based on the activity of growth plates (epiphyseal plates). These plates are cartilage tissues located at the ends of bones that produce new bone tissue through the following processes:
-
Chondrocyte proliferation: Cartilage cells (chondrocytes) in the growth plate divide, creating new cells.
-
Cartilage mineralization: The new cartilage tissue gradually ossifies, contributing to the increase in bone length.
-
Growth plate closure: At the end of puberty, the growth plates ossify (close), which stops further longitudinal growth. This typically occurs between ages 16-18 in boys, but may vary between individuals.
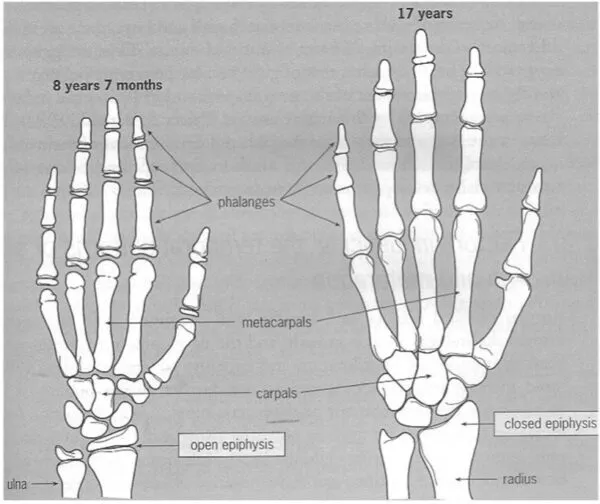 Epiphyseal plates in open and closed states / https://medcell.org/tbl/disorders_of_growth/reading.php
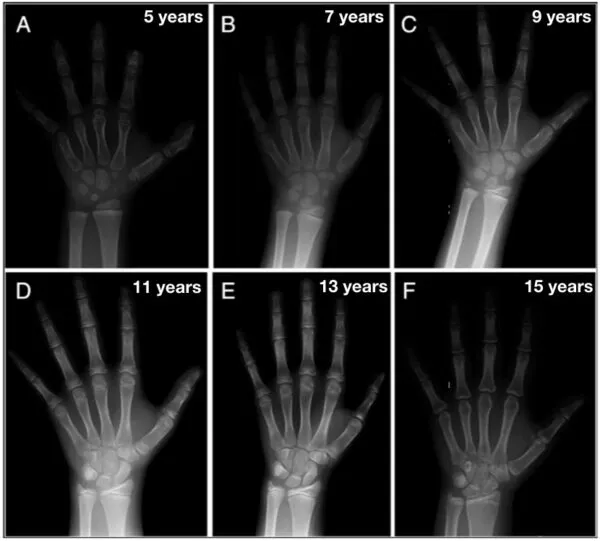 X-ray of epiphyseal plates in open and closed states / https://medcell.org/tbl/disorders_of_growth/reading.php
Genetic Factors
Height is determined 60-80% by genetic factors, as supported by twin studies. Parental height (given proper childhood nutrition) is a strong predictor of a child’s final height. This is the basis of the Mid-parental height method:
-
Expected height for boys: For boys, 13 centimeters are added to the average of the parents’ heights, and this value is then divided by two. This reflects the fact that boys are generally taller than the average of their parents.
-
Expected height for girls: For girls, 13 centimeters are subtracted from the average of the parents’ heights, and this value is divided by two, since girls are generally shorter than the average of their parents.
This method estimates with a margin of error of ±5-10 cm, since it is not at all certain that the parents reached their own genetic potential - it is quite possible that poor nutrition in their youth made them shorter than they could have been.
A child’s expected height in centimeters can be estimated more accurately using the Khamis-Roche method, which takes into account parental height, the child’s current height and weight, as well as age and sex: https://www.calculator.net/height-calculator.html
Beyond genetics, nutrition, sleep and other environmental factors also influence final height:
-
Nutrition: Adequate intake of calories, protein, calcium (1,000-1,300 mg/day) and vitamin D (600-800 IU/day) is essential for bone development. Malnutrition or nutrient deficiency (even from significant physical activity) can hinder growth.
-
Sleep: A significant portion of growth hormone is produced during deep sleep (REM and slow-wave sleep). 8-10 hours of sleep per day is recommended for the 13-17 age group to support growth.
-
Physical activity: Regular exercise supports bone density and muscle development (Participation in sports in relation to adolescent growth and development).
Childhood Weight Gain
Childhood weight gain is key to the physical development of young hockey players, but the emphasis is on healthy muscle development and building overall athletic capabilities. Weight gain should support muscle development, endurance and coordination without leading to excessive body fat accumulation, which can negatively affect performance.
The period between ages 6-12 is critical for physical development, as fundamental motor skills and muscle-coordination capabilities are formed during this time. During puberty (ages 12-15), hormonal changes - especially the increase in testosterone - promote muscle mass growth, particularly in the lower body (quadriceps, gluteus, hamstrings) and the trunk, which are crucial for skating and physical play. Multi-sport activities are recommended during this period to provide a broad athletic foundation, reducing the risks of early specialization, injuries or burnout.
Weight and Center of Gravity in the NHL
The physical requirements of NHL players have changed over the years, with modern play emphasizing speed and agility over sheer size. The average NHL player weighs approximately 90-93 kg. According to 2019-2020 season data, the average NHL player is 185 cm tall and weighs 90.4 kg. By position, defensemen are the largest with an average of 92 kg, while centers are the lightest at 89.3 kg.
A low center of gravity is crucial in hockey, as it significantly improves player performance in several respects. A low center of gravity helps players maintain balance while skating, especially during quick direction changes, stops and physical contact. Proper posture lowers the center of gravity, keeping the player more stable on the ice (Hockey Skating: 5 Flaws & How to Correct Them).
Players with a low center of gravity are harder to separate from the puck, as they are more stable and resistant to physical collisions. A deeper stance allows players to make more powerful pushes while skating, increasing speed and acceleration. This is especially important during quick breakouts and maneuvering in the offensive zone.
Size Improves the Odds, but Technique and IQ Will Be Decisive
The biological and physical development of youth players is a complex process influenced by many factors, including the relative age effect, biological maturity, peak height velocity (PHV), nutrition, sleep and physical activity. Players born at the beginning of the year may have physical advantages due to the relative age effect, which can result in selection bias, while late-maturing players are often more successful in the NHL in the long run. Proper nutrition, sufficient sleep and multi-sport activities support healthy muscle development and coordination, while the risks of excessive early specialization can be minimized.
In hockey, physical attributes such as height and body weight can provide clear advantages, but the modern style of play prioritizes speed, agility and hockey intelligence, enabling smaller players (e.g., two-time Stanley Cup winner Brad Marchand at 175 cm / 80 kg, and Cole Caufield at 173 cm / 79 kg) to achieve success.
For long-term success, the integrated development of physical, technical, tactical and mental skills is required - combining PHV with other objective indicators and taking into account individual differences and each player’s full developmental potential.

Sources:
-
Bacon, C. S., & Mauger, A. R. (2017). Participation in sports in relation to adolescent growth and development. Translational Pediatrics, 6*(3), 150-159.
-
Cumming, S. P., Lloyd, R. S., Oliver, J. L., Eisenmann, J. C., & Malina, R. M. (2017). Bio-banding in youth ice hockey: Players’ perceptions and coaches’ preferences. Journal of Strength and Conditioning Research, 31(2), 304-313.
-
Dvorak, J., George, J., Junge, A., & Hodler, J. (2007). Do physical maturity and birth date predict talent in male youth ice hockey players?. Journal of Sports Sciences, 25(8), 879-886.
-
Gledhill, A., & Harwood, C. (2019). Effects of physical activity on children’s growth. Jornal de Pediatria, 95(Suppl 1), 72-78.
-
Granacher, U., Lesinski, M., Büsch, D., Muehlbauer, T., Prieske, O., Puta, C., Gollhofer, A., & Behm, D. G. (2016). Effects of resistance training in youth athletes on muscular fitness. Sports Medicine, 46(7), 993-1030.
-
Hancock, D. J., Ste-Marie, D. M., & Young, B. W. (2013). The Relative Age Effect at the Ice Hockey World Championships (IHWC) in the Years 2015-2017. International Review for the Sociology of Sport, 48(3), 347-355.
-
Haywood, X., Dupuis, D., & Martin, L. J. (2023). Developmental activities of elite junior hockey players: An analysis of early sport specialization. Journal of Strength and Conditioning Research, 37(8), e465-e471.
-
Tervo, T., & Nordström, A. (2024). Who Reaches the NHL? A 20-Year Retrospective Analysis of Junior and Adult Ice Hockey Success. Sports Medicine - Open, 10(1), 50.
-
Vigh-Larsen, J. F., & Mohr, M. (2018). Biological maturation and self-regulation in soccer players: Underdog hypothesis. Psychology of Sport and Exercise, 39, 135-141.
Further Sources:
-
Horton Barbell. (2024). Average Height and Weight of Hockey Players (NHL 2024).
-
JokerMag. (2025). Average Height of NHL Players in 2025 (By Position).
-
Kritz, M. (n.d.). Hockey Skating: 5 Flaws & How to Correct Them. CrossIceHockey.com.
-
Pension Plan Puppets. (2023). How big are the Leafs?.
-
Stack. (n.d.). How Big Is the Average NHL Player?.
-
Starting Hockey. (n.d.). Does Size Matter in Hockey?.
-
Wikipedia. (n.d.). Height in sports.
-
ADM Kids. (n.d.). 10U: Should My Child Be ‘Playing Up?’.
-
ADM Kids. (n.d.). V-Velocity in PHV.
-
Changing the Game Project. (n.d.). Help, My Child is a Late Bloomer: 5 Tips for Overcoming the “Relative Age Effect” in Youth Sports.
-
Science for Sport. (n.d.). Relative Age Effect.
-
Open University. (n.d.). Human Growth and Development.
-
Frontiers in Endocrinology. (2022). Growth patterns in children with different peak height velocity.
-
MedCell. (n.d.). Disorders of Growth.
-
Magyar Jégkorong Szövetség. (2022). Edzéselméleti alapok.
-
Elite Prospects. (n.d.). NHL Stats All-time totals.
-
Calculator.net. (n.d.). Child Height Predictor.
-
National Center for Biotechnology Information. (n.d.). Epigenetics and human growth: Insights from molecular studies.
-
National Center for Biotechnology Information. (n.d.). Secular trends in height and weight among children and adolescents.
-
National Center for Biotechnology Information. (n.d.). Effects of nutrition on growth.
-
National Center for Biotechnology Information. (n.d.). Sleep and growth in children: A review.
-
Hockey Graphs. (2015). NHL Player Size From 1917-18 to 2014-15: A Brief Look.
-
ESPN. (2023). Does height still matter for NHL draft prospects?.